
# Prerequisite knowledge
# Bitmap
Also known as bitmap image, pixel image, or raster image, it is composed of pixels. These points can be arranged and colored differently to form an image.
Bitmap Characteristics:
- Bitmap images are good at reproducing subtle gradations of color, capable of creating images with rich variations in color and brightness, realistic colors, large files, and cannot be scaled arbitrarily;
- The larger the image size, the larger the file; the richer the image color, the larger the file.
- The precision of printing and output is limited;
- Bitmap file formats: such as .tiff, .bmp, .gif, .jpg, .png, .psd, etc.
- Common bitmap editing software: Photoshop, etc.
# Vector graphics
Vector is also known as “vector,” and the graphic elements (points and line segments) in vector images are called objects. Each object is an individual entity with attributes such as size, direction, outline, color, and screen position. Simply put, vector graphic software uses mathematical methods to draw basic shapes like rectangles.
Vector Graphic Features:
- Can be infinitely enlarged without worrying about distortion;
- Vector graphics can be easily converted to bitmap, while converting bitmap to vector graphics requires methods like image tracing, but perfectly converting to vector graphics is still somewhat challenging.
- Vector graphic file formats: Such as Adobe Illustrator’s .AI, .EPS, .SVG, .PDF, AutoCAD’s .dwg and .dxf, Windows standard metafile *.wmf and enhanced metafile *.emf, etc.
- Common vector graphics editing software: Illustrator, CorelDraw, AutoCAD, etc.
# The relationship between pixels, DPI, and print size
The mathematical relationship between image resolution, number of pixels, and print size is: Pixels = Resolution (DPI) × Print Size (in inches).
Among them, DPI is the number of pixels per square inch, which is a measure of the image’s level of detail. Understanding the above concepts, we can infer the image size using these concepts. For example, if I want to print an 8-inch * 10-inch, 300 DPI image, how should I set the pixel width and height of the image? You simply multiply the two together, $8 \times 300=2400$, $10 \times 300=3000$, so the pixel dimensions of this image are $2400 \times 3000$.
# Magazine requirements
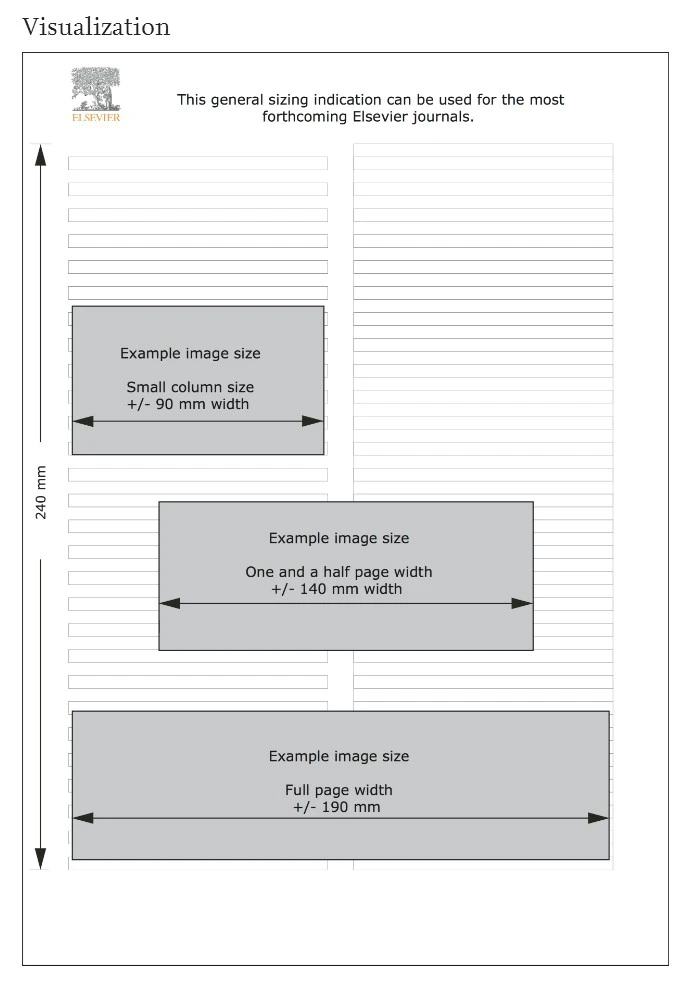
Here, taking the example of the requirements from the well-known publisher Elsevier :
| TARGET SIZE | Image Width | Pixels at 300 dpi | Pixels at 500 dpi | Pixels at 1000 dpi |
|---|---|---|---|---|
| Minimal size | 30 mm (85 pt) | 354 | 591 | 1181 |
| Single column | 90 mm (255 pt) | 1063 | 1772 | 3543 |
| 1.5 column | 140 mm (397 pt) | 1654 | 2756 | 5512 |
| Double column (full width) | 190 mm (539 pt) | 2244 | 3740 | 7480 |
By studying the content on image dimensions above, we can understand the relationship between print size, pixels, and dpi. For example, the table shows that the minimum image size required in red is $30 \mathrm{mm}$. We can use the formula to verify whether the printed size of 354 pixels wide at 300dpi resolution is indeed $30 \mathrm{mm}$: $354 \div 300 \times 2.54 \times 10 = 29.97 \mathrm{mm}$, the two numbers multiplied at the end convert inches to millimeters, which is exactly $30 \mathrm{mm}$. Knowing the above relationship, we can use Photoshop to edit our images.
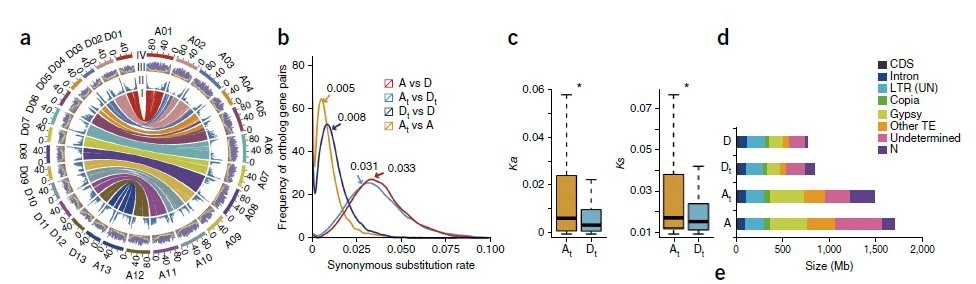
For example, an image from Mapman, opened with Photoshop, shows the following dimensions:
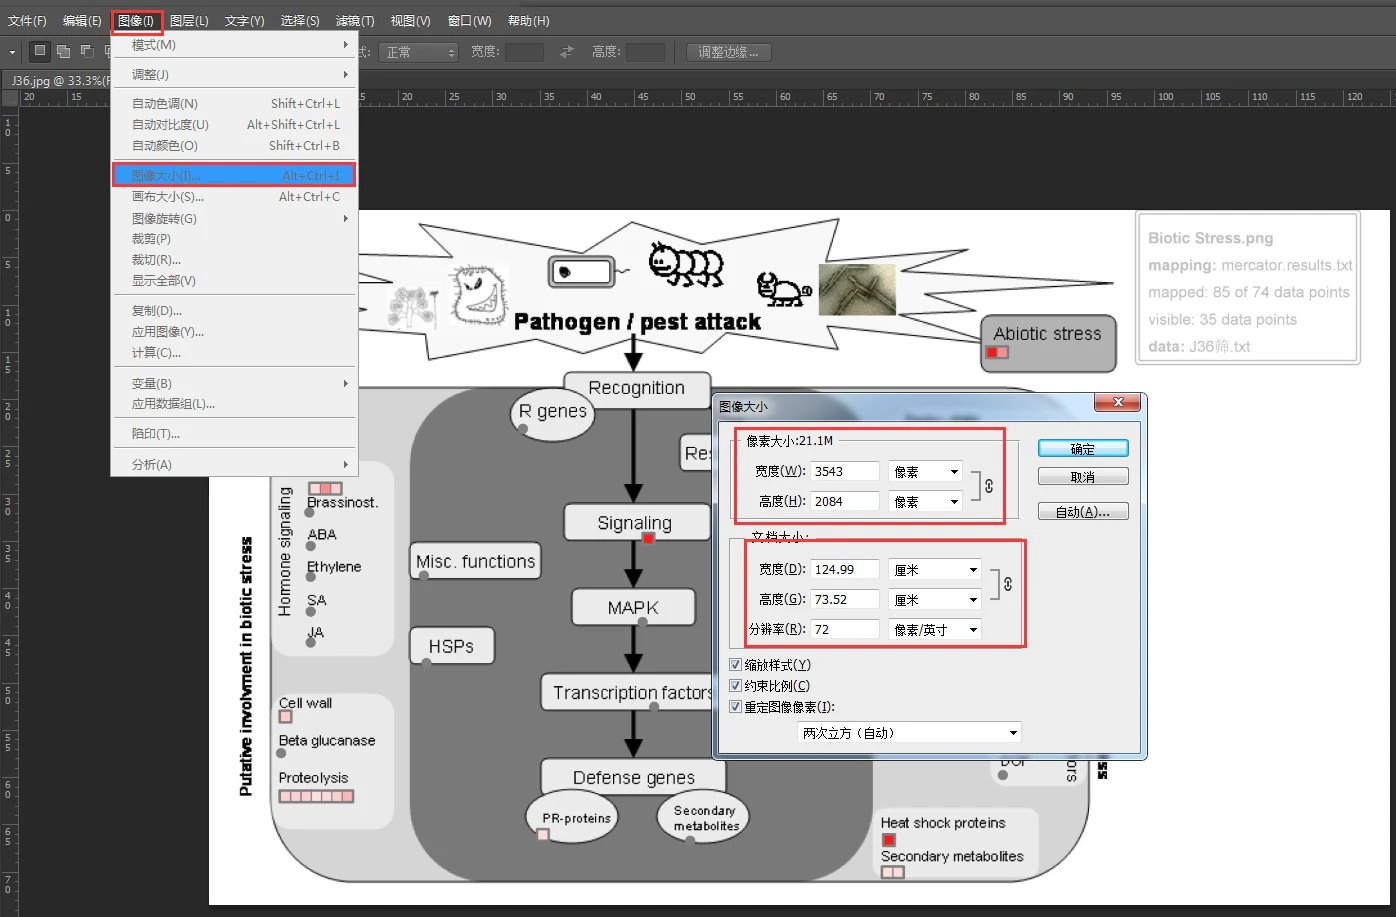
Due to the image size being too large, with a width of $124.99 \mathrm{cm}$, and a resolution of $72$, it does not meet the magazine requirements. Here, we will use the knowledge learned above to adjust the image size without losing image pixels;
Now we need to adjust the image width to a double-column size, which is $19\mathrm{cm}$; using the formula: pixels = resolution (DPI) × print size (in inches)
With the pixels unchanged, we need to increase the resolution to reduce the print size of the image. According to the ratio calculation, it should be increased to how much dpi: $124.99 \div 19 \times 72=473.6 \mathrm{dpi}$;
So, modifying these two values of width and resolution is sufficient, and the number of pixels in the image remains unchanged, achieving a lossless change in the image size; moreover, 473dpi is greater than the minimum 300dpi.
# Matplotlib Python library
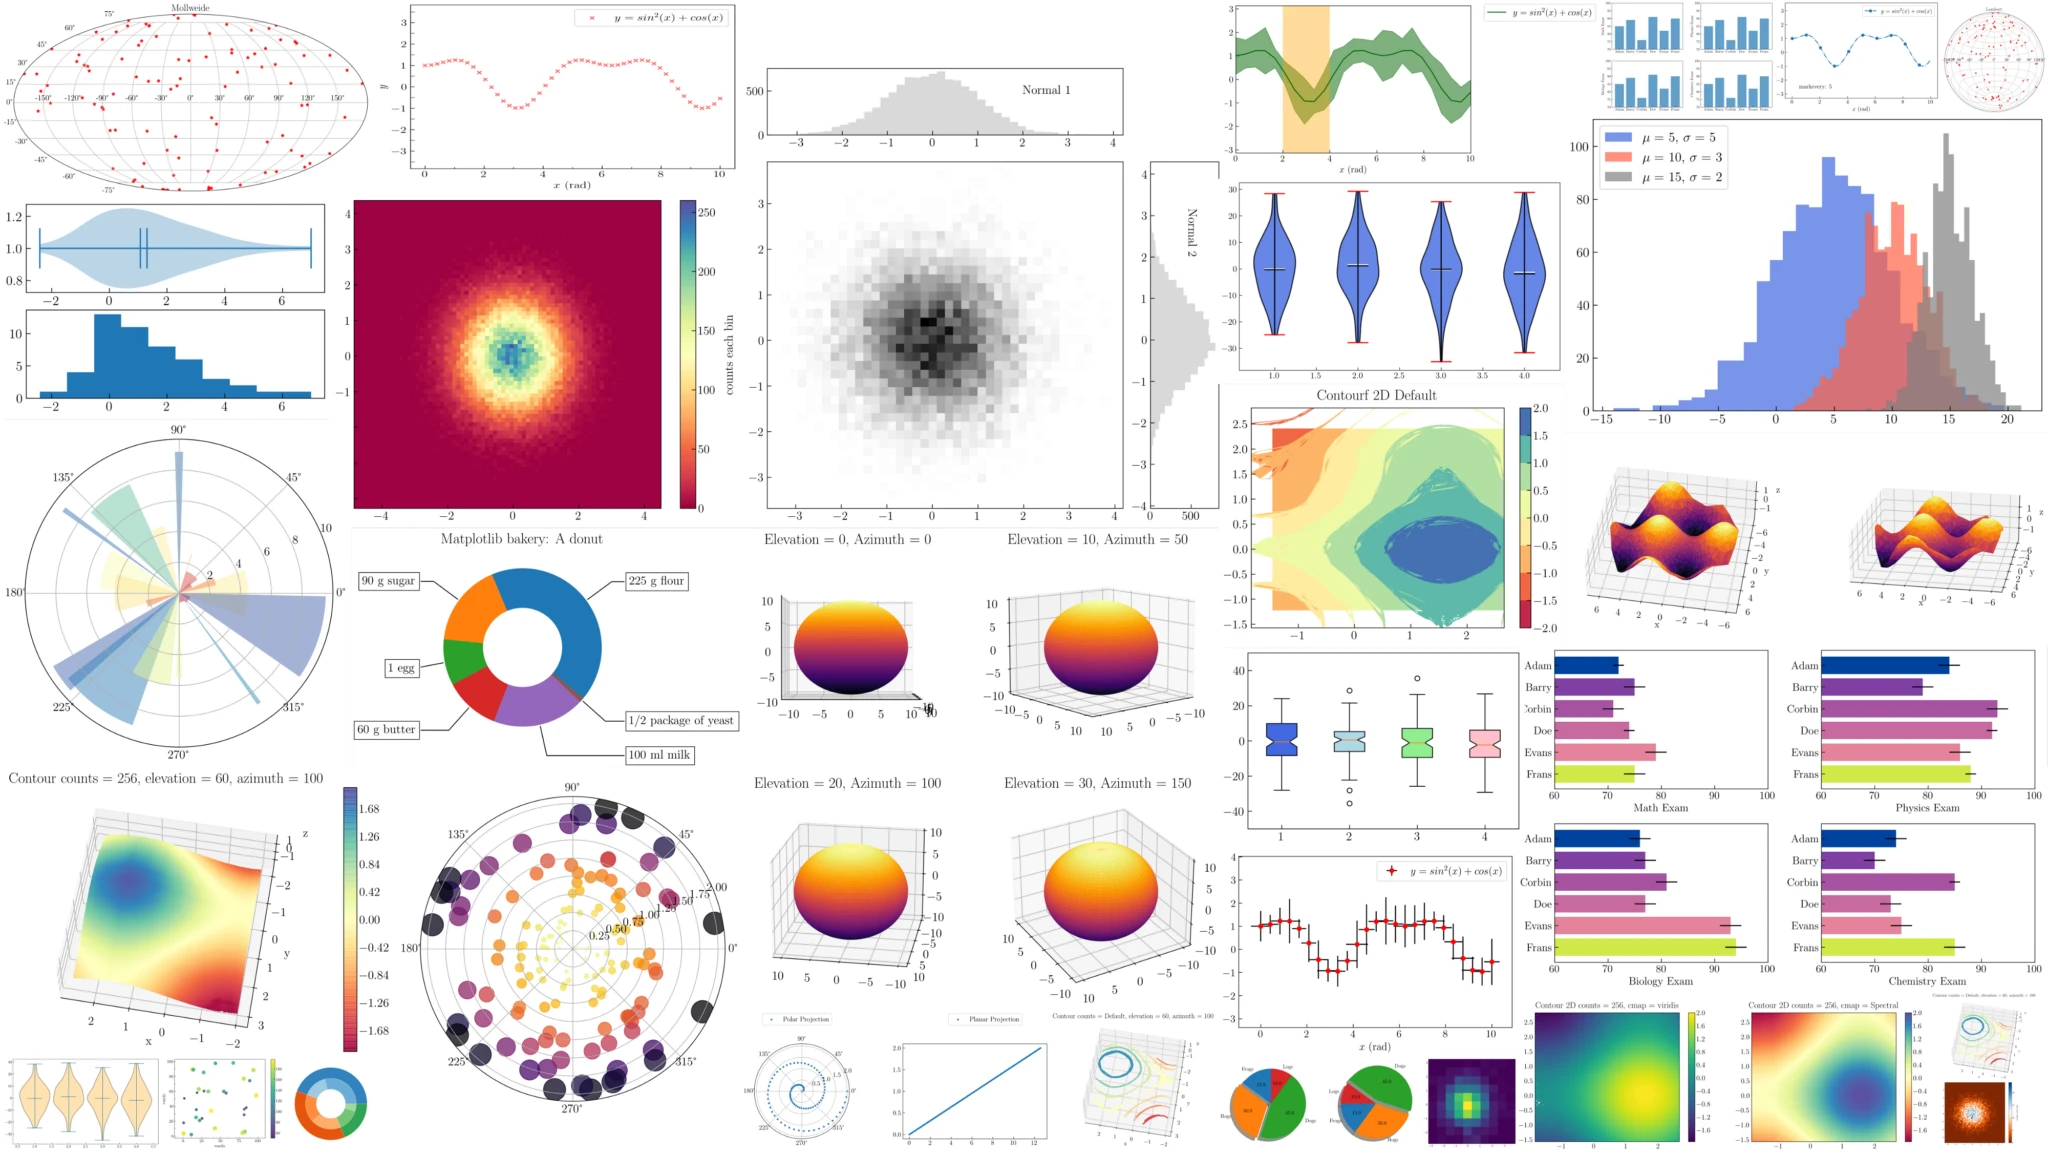
As the most fundamental and widely used data visualization library in the Python ecosystem, Matplotlib offers rich 2D and 3D plotting capabilities, particularly suitable for creating common scientific charts such as line charts, bar charts, and scatter plots. It also allows for highly customizable output styles to meet the standards of various academic journals.
It can be used to draw various static, dynamic, and interactive charts. We can use this tool to present a lot of data more intuitively in the form of charts, including drawing line charts, scatter plots, contour plots, bar charts, histograms, 3D graphics, and even graphic animations, etc.
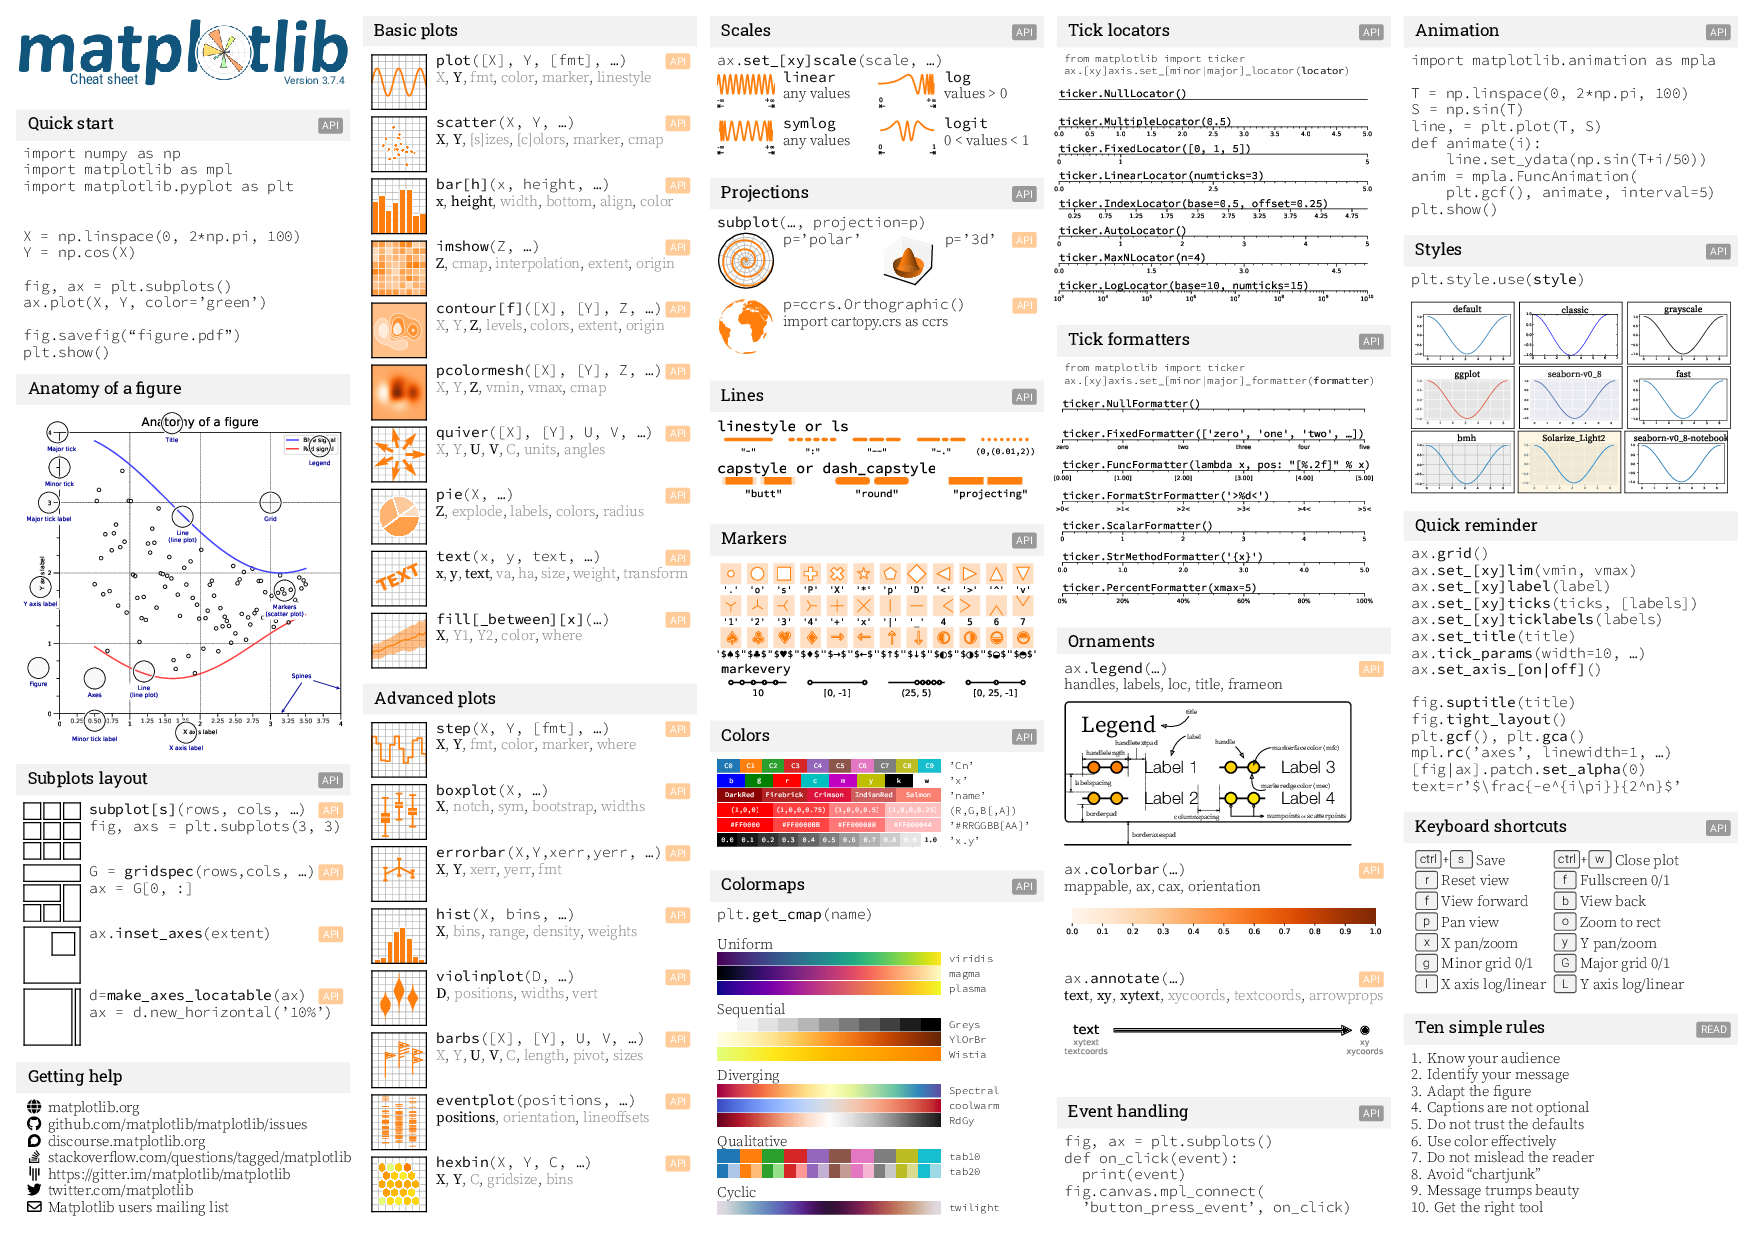
- Matplotlib Cheat Sheet
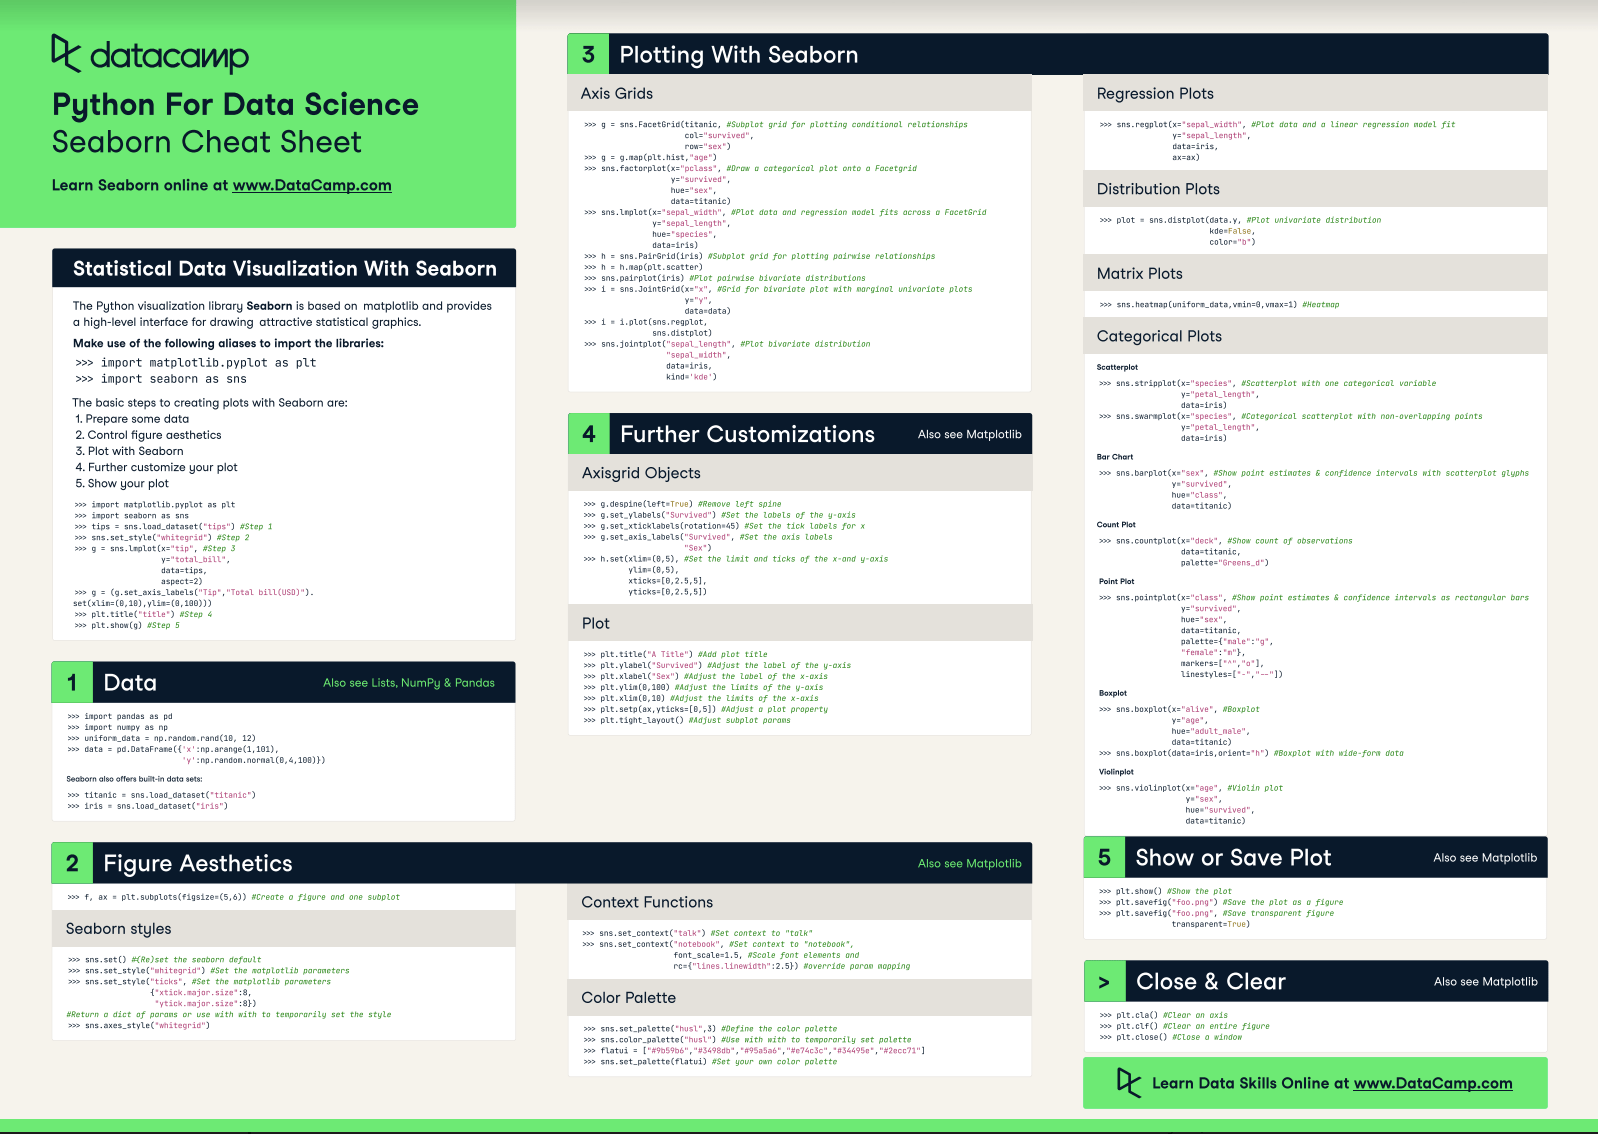
# Seaborn Python library
Built on top of Matplotlib, Seaborn further enhances the functionality of statistical charts. It comes with many advanced statistical chart styles, such as heatmaps, box plots, and time series analysis charts, making the presentation of complex data relationships more intuitive and readable. Since it is based on Matplotlib, many of Seaborn’s chart interfaces and parameter settings are quite similar to it, making plotting more convenient and fast. Even those without much foundation can create aesthetically pleasing graphics with analytical value through minimal code.
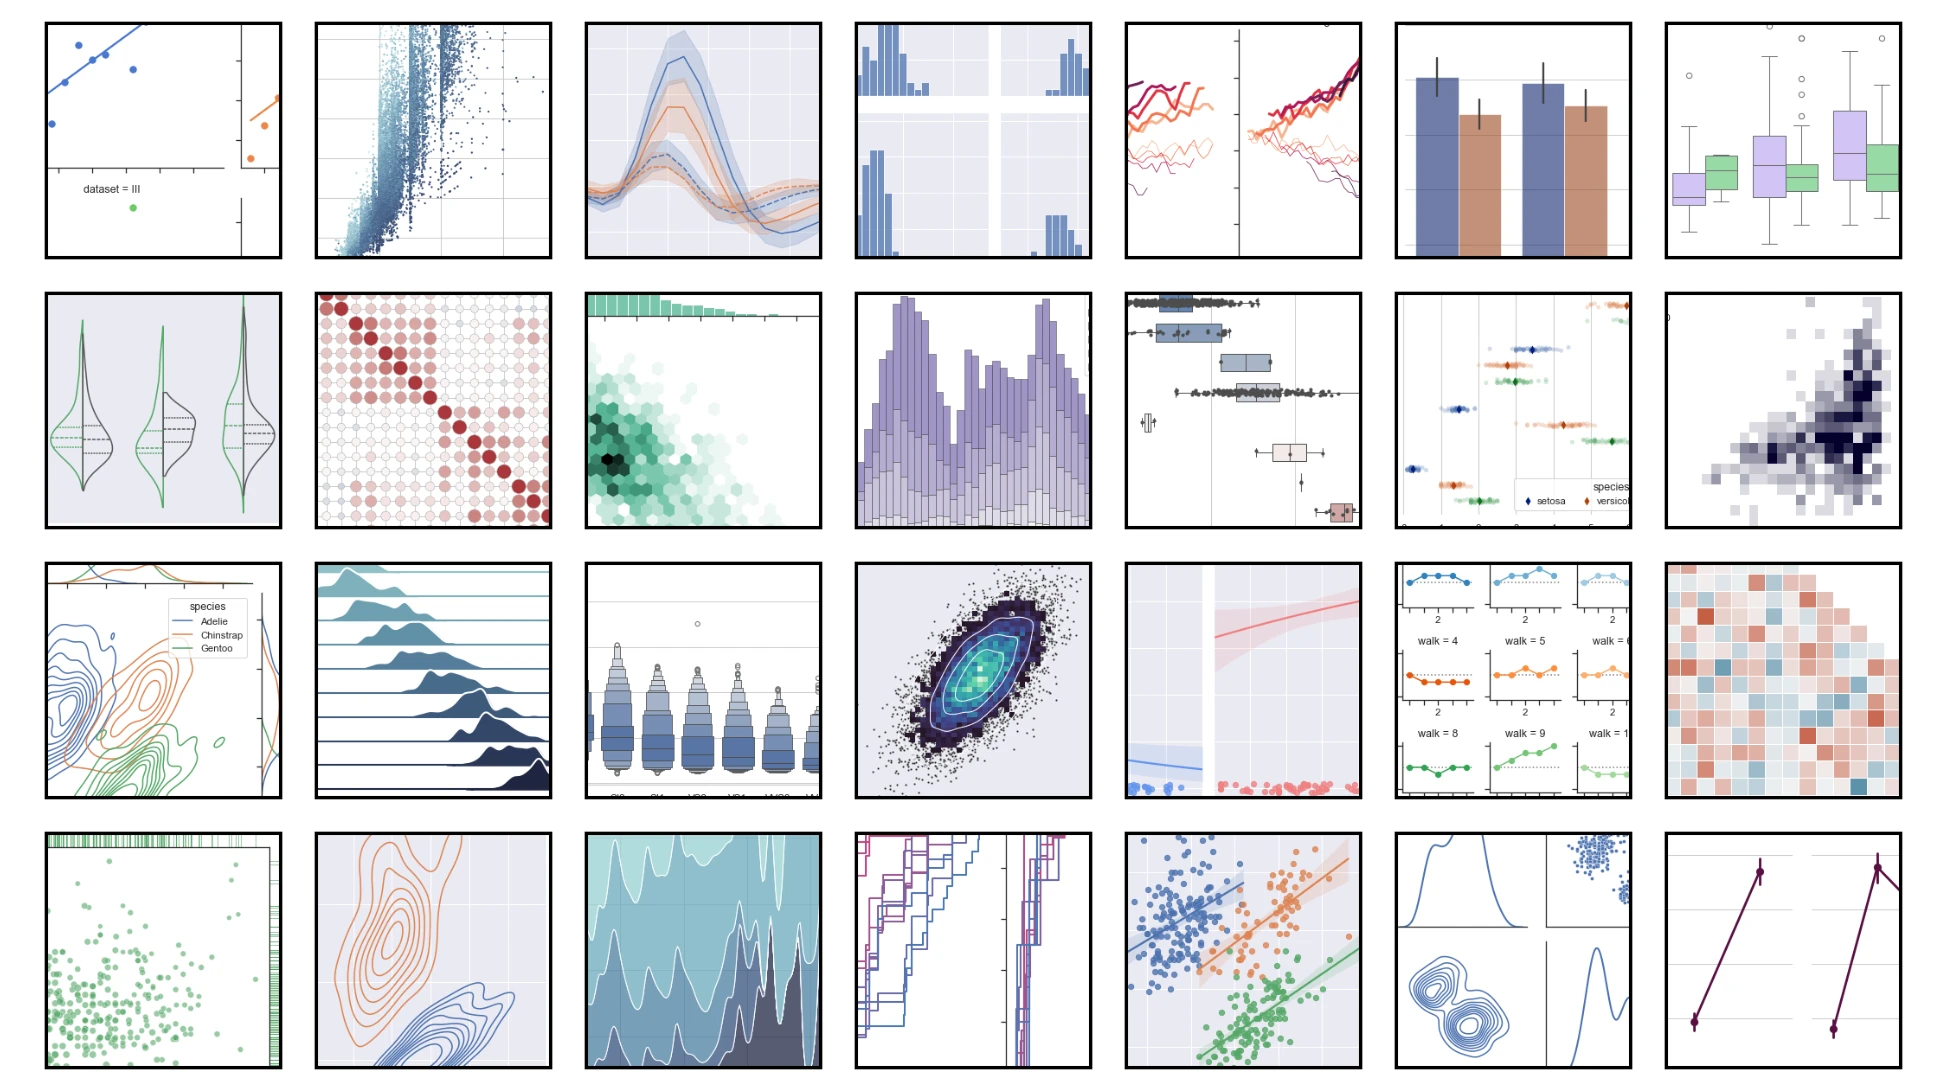
- Seaborn Cheat Sheet
- Excellent tutorial: Data Visualization, Seaborn makes plotting so beautiful
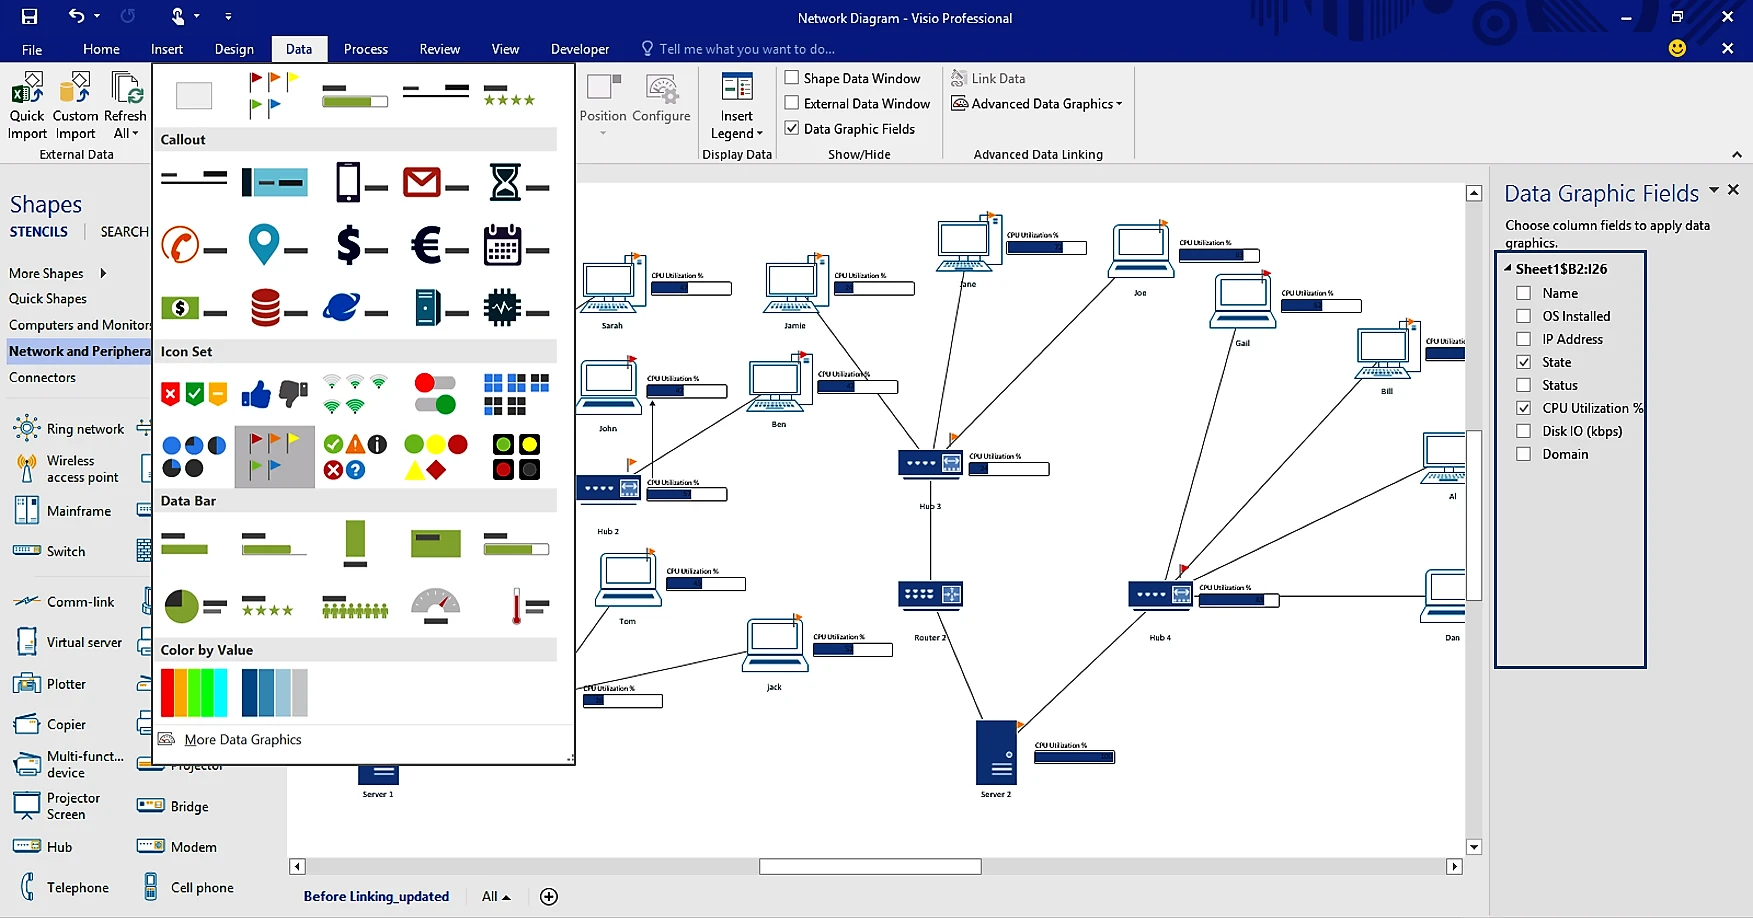
# Visio vector graphics software (framework flowcharting and algorithm structure)
For chart designs that are not data-intensive but have rigorous logic, such as experimental flowcharts, system architecture diagrams, or algorithm flowcharts, Microsoft Visio, with its powerful vector editing capabilities and vast array of preset templates, has become the ideal choice for constructing clear and standardized flowcharts.
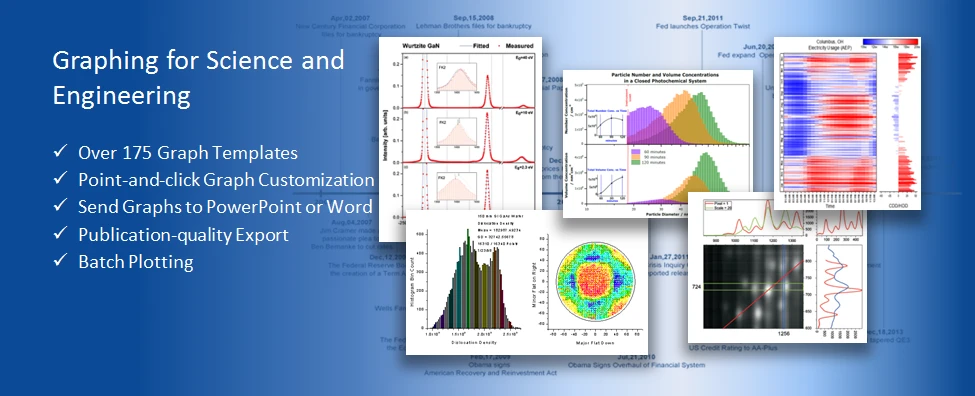
# Origin Vector Graphics Software (Mathematical Analysis and Function Plotting)
Origin is a scientific graphing and data analysis software developed by OriginLab Corporation, supporting operation under Microsoft Windows. Origin supports a variety of 2D/3D graphics. The data analysis features in Origin include statistics, signal processing, curve fitting, and peak analysis. Curve fitting in Origin uses the nonlinear least squares fitting based on the Levenberg-Marquardt algorithm (LMA). Origin’s powerful data import capabilities support various data formats, including ASCII, Excel, NI TDM, DIADem, NetCDF, SPC, and more. The graphic output formats are diverse, such as JPEG, GIF, EPS, TIFF, etc. The built-in query tool can access database data through ADO.
In the fields of physics, chemistry, and biology, Origin is renowned for its powerful mathematical analysis and function plotting capabilities, specifically designed for scientific data analysis. It is particularly suitable for plotting precise signal curves, spectrum analysis graphs, and other complex scientific graphics.
# AI (Adobe Illustrator) vector graphics software
As an industry-standard vector graphics processing software, Illustrator is not only suitable for high-precision, publication-grade chart design but also capable of creating high-quality scientific illustrations, ensuring clear and delicate effects at any size. It is an industry-standard vector illustration software used in publishing, multimedia, and online images. The software is mainly used in print publishing, poster and book layout, professional illustration, multimedia image processing, and web page production. It can also provide high precision and control for line art, suitable for producing any small design to large and complex projects.
In chart plotting, it is mainly applied in: direct plotting - rarely used in computer science and control classes, but students in the biochemical, environmental, and material fields use AI to achieve operations like cell structure and ventricle highlighting; integrating previously exported individual vector graphics; converting non-vector graphics to vector graphics.

# Inkscape vector graphics software
AI’s alternative version, with the advantage of being open source and free. As a leader in the open-source vector graphics editor community, Inkscape offers a complete set of SVG editing tools, allowing researchers to use it for free to create complex vector diagrams, ensuring cross-platform compatibility and lossless scalability. Official Chinese site: Inkscape
Detailed introduction: Inkscape - Free open-source, cross-platform vector graphics design software, alternative to Adobe Illustrator (AI) and CorelDRAW
Recommended video tutorial: